Given below is the scatter plot of the market value (thousands$)and profit (thousands$)of 50 Australian companies.Higher market values appear to be associated with higher profits. 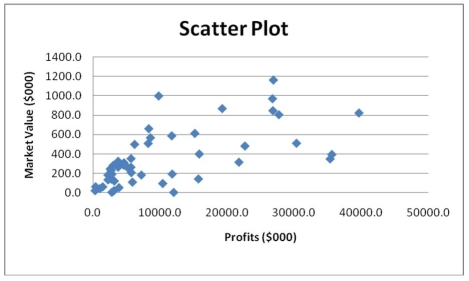
Correct Answer:
Verified
Q173: Instruction 2.11
The table below contains the
Q174: Instruction 2.11
The table below contains the
Q175: Instruction 2.11
The table below contains the
Q176: Instruction 2.11
The table below contains the
Q177: Instruction 2.11
The table below contains the
Q179: Instruction 2.11
The table below contains the
Q180: Instruction 2.11
The table below contains the
Q181: Which of the following is not a
Q182: You have collected data on the approximate
Q183: One of the guidelines for presenting good
Unlock this Answer For Free Now!
View this answer and more for free by performing one of the following actions

Scan the QR code to install the App and get 2 free unlocks

Unlock quizzes for free by uploading documents