Given below is the scatter plot of the price/earnings ratio versus earnings per share of 20 Australian companies.There appears to be a positive relationship between price/earnings ratio and earnings per share. 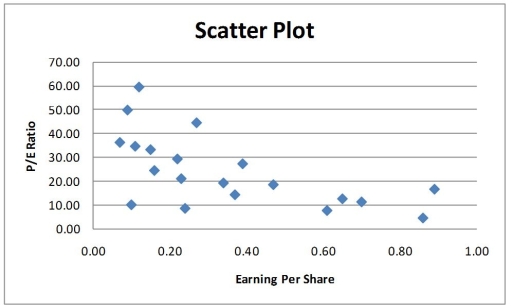
Correct Answer:
Verified
Q164: Instruction 2.11
The table below contains the
Q165: A scatter diagram can be used to
Q166: Instruction 2.11
The table below contains the
Q167: Given below is the scatter plot of
Q168: Instruction 2.11
The table below contains the
Q170: Instruction 2.11
The table below contains the
Q171: Instruction 2.11
The table below contains the
Q172: Instruction 2.11
The table below contains the
Q173: Instruction 2.11
The table below contains the
Q174: Instruction 2.11
The table below contains the
Unlock this Answer For Free Now!
View this answer and more for free by performing one of the following actions

Scan the QR code to install the App and get 2 free unlocks

Unlock quizzes for free by uploading documents