Consider the data that generate this plot covering time for months numbered 1 to 50. What characteristic is most prominent in the pattern? 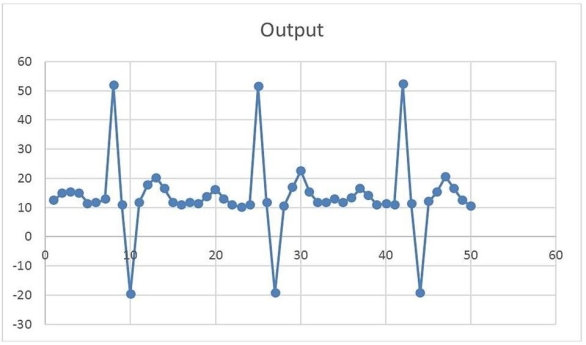
A) trend
B) seasonality
C) randomness
D) none
Correct Answer:
Verified
Q17: A counseling service records the number
Q18: A firm's demand data from the
Q19: A counseling service records the number
Q20: The Delphi method, panel consensus forecasting, and
Q21: Two time series techniques that are appropriate
Q23: Fluctuations in demand due to seasonality are
Q24: Exponential smoothing with an alpha of one
Q25: A(n)_ forecasting model bases all forecasts on
Q26: Examine these two graphs and based on
Q27: The greater the randomness in the data,
Unlock this Answer For Free Now!
View this answer and more for free by performing one of the following actions

Scan the QR code to install the App and get 2 free unlocks

Unlock quizzes for free by uploading documents