The figure shows a pV diagram of a gas for a complete cycle. During part bc of the cycle, 1190 J of heat flows into a system, and at the same time the system expands against a constant external pressure of as its volume increases from to Calculate the change in internal (thermal) energy of the system during part bc of the cycle. If the change is nonzero, be sure to indicate whether the change is positive or negative. 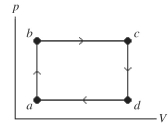
Correct Answer:
Verified
Q29: A heat engine absorbs 64 kcal of
Q34: A heat engine receives 7000 J of
Q37: An athlete doing push-ups performs 650 kJ
Q45: A sealed rigitd tank contains 30
Q46: A cylinder contains 13 moles of an
Q48: An expandable container holds 2.30 mole of
Q49: A cylinder contains 10 moles of an
Q50: An ideal gas undergoes the process
Q52: An expansion process on an ideal
Q77: A 40.0-L container is divided into two
Unlock this Answer For Free Now!
View this answer and more for free by performing one of the following actions

Scan the QR code to install the App and get 2 free unlocks

Unlock quizzes for free by uploading documents