The figure shows a p diagram for a gas going through a cycle from A to B to C and back to A. From point A to point B, the gas absorbs 50 J of heat and finds its internal (thermal) energy has increased by 20 J. Going from B to C, the internal (thermal) energy decreases by 5.0 J.
(a) How much work was done by the gas from A to B?
(b) How much heat was absorbed by the gas from B to C?
(c) How much work was done by the gas going from B to C? 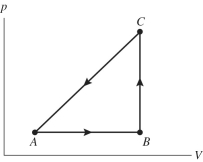
Correct Answer:
Verified
View Answer
Unlock this answer now
Get Access to more Verified Answers free of charge
Q23: A person running in place on an
Q26: The work done on an ideal gas
Q27: During an isothermal process,5.0 J of heat
Q30: A person consumes a snack containing 14
Q32: At room temperature,a typical person loses energy
Q33: The gas in a perfectly insulated
Q36: During an isochoric process,the internal (thermal)energy of
Q38: Oxygen condenses into a liquid at approximately
Q38: An ideal gas undergoes an adiabatic process
Q39: A fixed amount of an ideal monatomic
Unlock this Answer For Free Now!
View this answer and more for free by performing one of the following actions

Scan the QR code to install the App and get 2 free unlocks

Unlock quizzes for free by uploading documents