The figure shows a graph of the position x of two cars, C and D, as a function of time t. 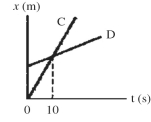 According to this graph, which statements about these cars must be true? (There could be more than one correct choice.)
A) The magnitude of the acceleration of car C is greater than the magnitude of the acceleration of car D.
B) The magnitude of the acceleration of car C is less than the magnitude of the acceleration of car D.
C) At time t = 10 s, both cars have the same velocity.
D) Both cars have the same acceleration.
E) The cars meet at time t = 10 s.
Correct Answer:
Verified
Q21: Two objects are dropped from a bridge,an
Q26: A ball is thrown downward in the
Q30: A 10-kg rock and 20-kg rock are
Q39: A ball is thrown straight up,reaches a
Q44: The motions of a car and a
Q45: The area under a curve in a
Q45: A child standing on a bridge throws
Q46: If, in the figure, you start from
Q55: A polar bear starts at the North
Q57: What must be your average speed in
Unlock this Answer For Free Now!
View this answer and more for free by performing one of the following actions

Scan the QR code to install the App and get 2 free unlocks

Unlock quizzes for free by uploading documents