The following scatterplot shows productivity and number hired workers with a fitted quadratic regression model. 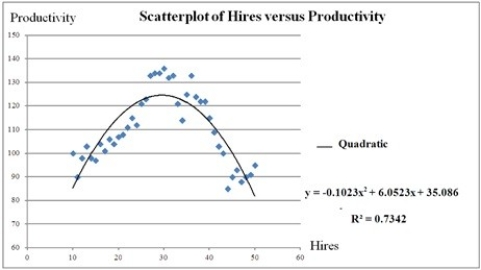 The quadratic regression model is ________.
A)  = 35.086 + 6.0523Hires - 0.1023Hires2
B)
 = 6.0523 + 35.086Hires - 0.1023Hires2
C)
 = 6.0523 − 35.086Hires + 0.1023Hires2
D)
 = −0.1023 + 6.0523Hires + 35.086Hires2
Correct Answer:
Verified
Q22: Which of the following regression models is
Q23: The following scatterplot shows productivity and number
Q24: To compute the coefficient of determination R2
Q25: For the quadratic equation Q26: The following scatterplot shows productivity and number Q28: How many coefficients need to be estimated Q29: For a quadratic regression model , it Q30: What is the effect of b2 < Q31: For the quadratic regression equation Q32: The following scatterplot shows productivity and number![]()

Unlock this Answer For Free Now!
View this answer and more for free by performing one of the following actions

Scan the QR code to install the App and get 2 free unlocks

Unlock quizzes for free by uploading documents