The following scatterplot indicates that the relationship between the two variables x and y is ________. 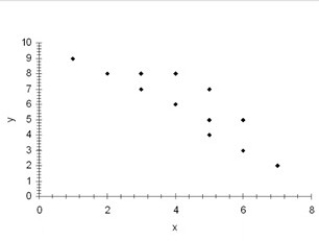
A) weak and positive
B) strong and positive
C) strong and negative
D) no relationship
Correct Answer:
Verified
Q32: We use _ to derive the coefficient
Q33: The numerical measure that gauges dispersion from
Q34: The relationship between the response variable and
Q35: When testing whether the correlation coefficient differs
Q36: The sample standard deviations for x and
Q38: When testing whether the correlation coefficient differs
Q39: Which of the following identifies the range
Q40: If the _ is substantially greater than
Q41: Given the augmented Phillips model: y =
Q42: The standard error of the estimate measures
Unlock this Answer For Free Now!
View this answer and more for free by performing one of the following actions

Scan the QR code to install the App and get 2 free unlocks

Unlock quizzes for free by uploading documents