The following frequency distribution shows the monthly stock returns for Home Depot for the years 2003 through 2007. 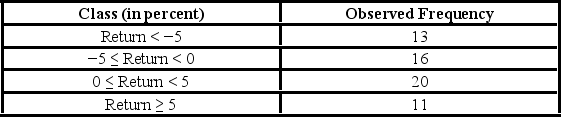 Over the time period, the following summary statistics are provided: Mean = 0.31%, Standard deviation = 6.49%, Skewness = 0.15, and Kurtosis = 0.38. The expected frequency for the class 0 ≤ Return < 5 if the return is normally distributed is ________.
A) 12.37
B) 16.44
C) 17.05
D) 14.15
Correct Answer:
Verified
Q106: The following frequency distribution shows the monthly
Q107: The following frequency distribution shows the monthly
Q108: A researcher wants to determine if the
Q109: The following frequency distribution shows the monthly
Q110: Suppose Bank of America would like to
Q112: The following table shows the observed frequencies
Q113: A researcher wants to verify his belief
Q114: Suppose Bank of America would like to
Q115: MARS claims that Skittles candies should be
Q116: The following table shows numerical summaries of
Unlock this Answer For Free Now!
View this answer and more for free by performing one of the following actions

Scan the QR code to install the App and get 2 free unlocks

Unlock quizzes for free by uploading documents