To approximate the width of a class in the creation of a bar chart, we may use this formula: 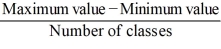
Correct Answer:
Verified
Q1: In order to summarize qualitative data, a
Q2: A bar chart depicts the frequency or
Q3: A scatterplot is a graphical tool that
Q4: A histogram is a series of rectangles
Q5: The percent frequency of a category equals
Q7: A stem-and-leaf diagram is useful in that
Q8: When constructing a scatterplot for two quantitative
Q9: Scatterplot is a graphical tool that is
Q10: When constructing a pie chart, only a
Q11: When summarizing quantitative data it is always
Unlock this Answer For Free Now!
View this answer and more for free by performing one of the following actions

Scan the QR code to install the App and get 2 free unlocks

Unlock quizzes for free by uploading documents