Refer to the diagram below.Points A,B,C,D,and E show: 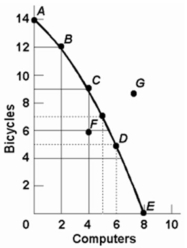
A) that the opportunity cost of bicycles increases,while that of computers is constant.
B) combinations of bicycles and computers which society can produce by using its resources efficiently.
C) that the opportunity cost of computers increases,while that of bicycles is constant.
D) that society's demand for computers is greater than its demand for bicycles.
Correct Answer:
Verified
Q78: A production possibilities curve illustrates
A)scarcity.
B)market prices.
C)consumer preferences.
D)the
Q103: The production possibilities curve illustrates the basic
Q104: If an economy is operating on its
Q106: In drawing the production possibilities curve we
Q108: The production possibilities curve shows:
A)the various combinations
Q112: The construction of a production possibilities curve
Q113: The production possibilities curve represents:
A)the maximum amount
Q114: Which of the following is not correct?
Q115: Assume an economy is operating at some
Q120: Which of the following is assumed in
Unlock this Answer For Free Now!
View this answer and more for free by performing one of the following actions

Scan the QR code to install the App and get 2 free unlocks

Unlock quizzes for free by uploading documents