Which of the following diagrams represents a situation where deliveries are frequently made to the specific warehouse where the delivered goods will be stored?
A) 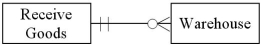
B) 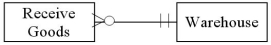
C) 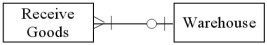
D) 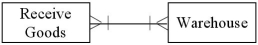
Correct Answer:
Verified
Q2: Sales order number is most likely to
Q8: Using an REA database design,which of the
Q12: For a service business,the minimum cardinalities between
Q22: Which of the following diagrams represents the
Q25: Which of the following diagrams represents a
Q26: Which of the following diagrams represents a
Q30: Since the same inventory items may be
Q31: Supplier number is most likely to be
Q42: Relationships between resources and agents,such as Inventory
Q52: Give an example of an M:N Agent-Event
Unlock this Answer For Free Now!
View this answer and more for free by performing one of the following actions

Scan the QR code to install the App and get 2 free unlocks

Unlock quizzes for free by uploading documents