Exhibit 10-3
The graph below shows a plot of angular velocity in rad/s versus time in s from t = 0 s to t = 7 s. 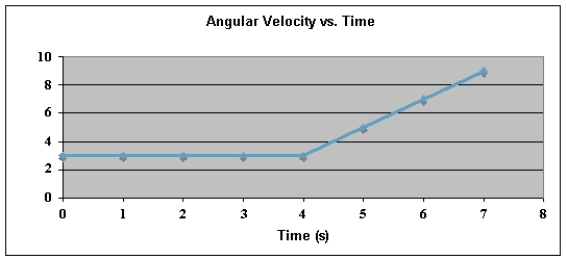 Use this exhibit to answer the following question(s) .
-Refer to Exhibit 10-3. The angular position, θ, at t = 0 s is 3.0 rad, clockwise. The angular position, θ, at t = 7 s is
A) 27 rad, CW.
B) 27 rad, CCW.
C) 33 rad, CW.
D) 33 rad, CCW.
E) 36 rad, CCW.
Correct Answer:
Verified
Q63: A solid sphere, a solid cylinder, and
Q64: The graph below shows a plot of
Q65: The net work done in accelerating a
Q66: A small sphere attached to a light
Q67: A small sphere attached to a light
Q69: Exhibit 10-2
The figure below shows a graph
Q70: A small sphere attached to a light
Q71: Which of the following diagrams shows the
Q72: When a wheel is rolling without slipping,
Q73: The angular speed of the hour hand
Unlock this Answer For Free Now!
View this answer and more for free by performing one of the following actions

Scan the QR code to install the App and get 2 free unlocks

Unlock quizzes for free by uploading documents