The graph below shows the velocity versus time graph for a ball.Which explanation best fits the motion of the ball as shown by the graph? 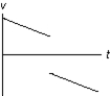
A) The ball is falling,is caught,and is thrown down with greater velocity.
B) The ball is rolling,stops,and then continues rolling.
C) The ball is rising,hits the ceiling,and falls down.
D) The ball is falling,hits the floor,and bounces up.
E) The ball is rising,is caught,and then is thrown down.
Correct Answer:
Verified
Q21: An object is thrown vertically upward such
Q24: A ball thrown vertically from ground level
Q29: An object is thrown downward with an
Q32: When Jim and Rob ride bicycles, Jim
Q36: When starting from rest at the bottom
Q40: Two identical balls are at rest side
Q40: The velocity at the midway point of
Q44: A 50-gram superball traveling at 25.0 m/s
Q48: Two children start at one end of
Q60: The area under a graph of ax
Unlock this Answer For Free Now!
View this answer and more for free by performing one of the following actions

Scan the QR code to install the App and get 2 free unlocks

Unlock quizzes for free by uploading documents