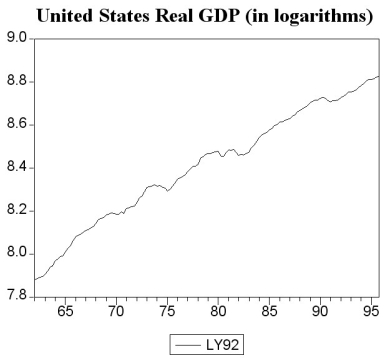
The following two graphs give you a plot of the United States aggregate unemployment rate for the sample period 1962:I to 1999:IV, and the (log)level of real United States GDP for the sample period 1962:I to 1995:IV. You want test for stationarity in both cases. Indicate whether or not you should include a time trend in your Augmented Dickey-Fuller test and why. 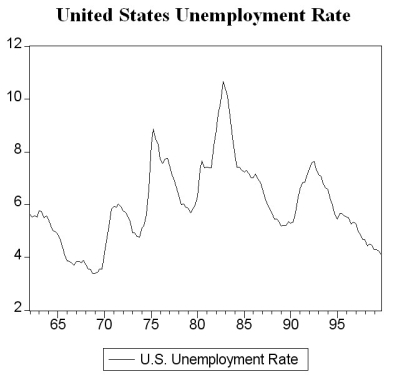
Correct Answer:
Verified
View Answer
Unlock this answer now
Get Access to more Verified Answers free of charge
Q39: (Requires Appendix material)Define the difference operator
Q40: The Bayes-Schwarz Information Criterion (BIC)is given
Q41: Find data for real GDP (Yt)for the
Q42: Consider the standard AR(1)Yt = β0
Q43: Consider the AR(1)model Yt = β0
Q45: You have decided to use the
Q46: You want to determine whether or not
Q47: (Requires Appendix material)The long-run, stationary state
Q48: Consider the following model
Yt = α0
Q49: You have collected data for real
Unlock this Answer For Free Now!
View this answer and more for free by performing one of the following actions

Scan the QR code to install the App and get 2 free unlocks

Unlock quizzes for free by uploading documents