The figure shows is a plot and a fitted linear regression line of the age-earnings profile of 1,744 individuals, taken from the Current Population Survey. 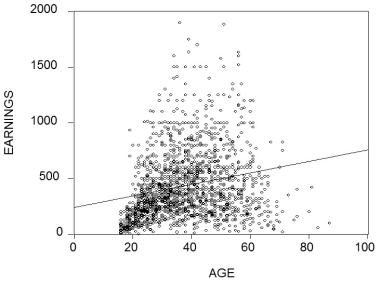 (a)Describe the problems in predicting earnings using the fitted line. What would the pattern of the residuals look like for the age category under 40?
(b)What alternative functional form might fit the data better?
(c)What other variables might you want to consider in specifying the determinants of earnings?
Correct Answer:
Verified
View Answer
Unlock this answer now
Get Access to more Verified Answers free of charge
Q49: To investigate whether or not there is
Q50: Many countries that experience hyperinflation do
Q51: Sketch for the log-log model what the
Q52: Earnings functions attempt to predict the
Q53: Show that for the following regression
Q55: In the case of perfect multicollinearity,
Q56: Give at least three examples from economics
Q57: Suggest a transformation in the variables
Q58: You have estimated an earnings function, where
Q59: In estimating the original relationship between
Unlock this Answer For Free Now!
View this answer and more for free by performing one of the following actions

Scan the QR code to install the App and get 2 free unlocks

Unlock quizzes for free by uploading documents