In the graph below, the vertical axis represents average real GDP growth for 65 countries over the period 1960-1995, and the horizontal axis shows the average trade share within these countries. 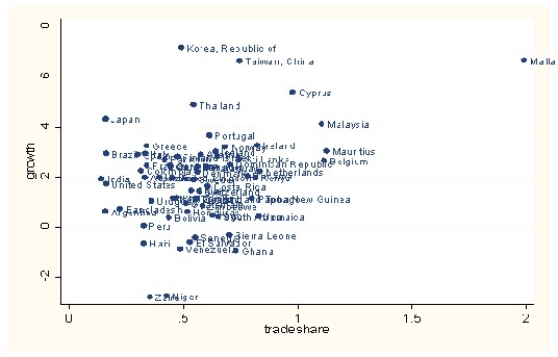 This is an example of
A) cross-sectional data.
B) experimental data.
C) a time series.
D) longitudinal data.
Correct Answer:
Verified
Q6: Ideal randomized controlled experiments in economics are
A)often
Q7: An example of a randomized controlled experiment
Q8: The accompanying graph Q9: Analyzing the behavior of unemployment rates across Q10: The most frequently used experimental or observational Q12: One of the primary advantages of using Q13: To provide quantitative answers to policy questions Q14: In a randomized controlled experiment Q15: The reason why economists do not use Q16: Analyzing the effect of minimum wage changes![]()
A)it
A)there is a
Unlock this Answer For Free Now!
View this answer and more for free by performing one of the following actions

Scan the QR code to install the App and get 2 free unlocks

Unlock quizzes for free by uploading documents