The following graph illustrates _______________. 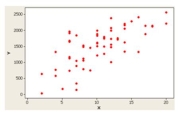
A) A positive or direct relationship
B) A negative or inverse relationship
C) No relationship
D) A distribution for a single variable
Correct Answer:
Verified
Q45: Outliers are clearly presented in a _.
A)
Q46: What is the value of the Pearson
Q46: In the following table, Q48: The following graph is _. Q49: If the coefficient of skewness is equal Q51: A sample of experienced typists revealed that Q52: Using the following statistics to describe a Q53: The median of a sample will always Q54: A contingency table would be used to Q55: In the following table, ![]()

![]()
Unlock this Answer For Free Now!
View this answer and more for free by performing one of the following actions

Scan the QR code to install the App and get 2 free unlocks

Unlock quizzes for free by uploading documents