The following graph is a ____________. 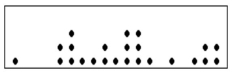
A) Dot plot
B) Stem-and-leaf diagram
C) Box plot
D) Contingency table
Correct Answer:
Verified
Q24: What does the interquartile range describe?
A)The range
Q25: The interquartile range is graphically presented in
Q26: A dot plot shows _.
A) The general
Q26: In a stem-and-leaf display,the leaf represents a
Q27: A dot plot is best applied for
Q28: A box plot shows _.
A) The mean
Q30: In the following set of data:
Q32: The following graph is a: 
Q33: A dot plot is best applied when
Q37: The test scores for a class of
Unlock this Answer For Free Now!
View this answer and more for free by performing one of the following actions

Scan the QR code to install the App and get 2 free unlocks

Unlock quizzes for free by uploading documents