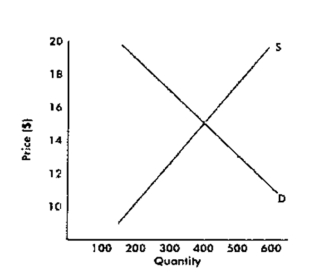
A.Draw another line on the graph representing a tax increase of $1.
B.How much is the new equilibrium price and quantity?
C.How much of the tax is borne by the buyers and how much is borne by the sellers?
Correct Answer:
Verified
View Answer
Unlock this answer now
Get Access to more Verified Answers free of charge
Q193: Advertisers try to _ the demand for
Q201: The demand for Phillips gasoline is more
Q202: Q203: In the graph above, draw a supply Q204: Draw another supply curve S to indicate Q206: In graph: (a) How much is the Q207: Draw a supply curve, S1. Then draw Q208: If demand for a good is very Q211: Along a downward-sloping straight-lined demand curve,the elasticity Q219: If demand and supply have the same![]()
Unlock this Answer For Free Now!
View this answer and more for free by performing one of the following actions

Scan the QR code to install the App and get 2 free unlocks

Unlock quizzes for free by uploading documents