Multiple Choice
Which one of the following graphs shows how the inductive reactance varies with frequency? 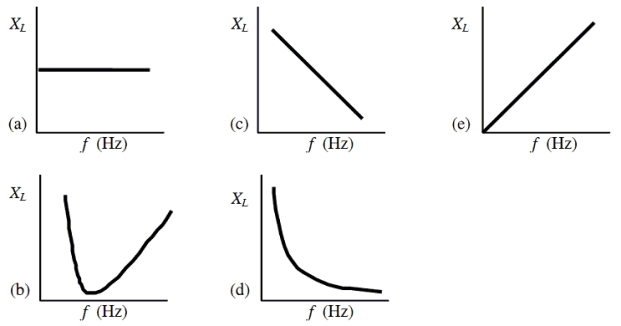
A) a
B) b
C) c
D) d
E) e
Correct Answer:
Verified
Related Questions
Q5: The graph shows the voltage across and
Q6: A variable capacitor is connected to an
Q7: The reactance of a capacitor in
Q8: The graph shows the voltage across
Q9: An ac voltage source that has a
Q11: A battery is used to drive a
Q12: The graph shows the voltage across and
Q13: An ac generator is connected across
Q14: A variable inductor is connected to an
Q15: When the frequency of an ac circuit
Unlock this Answer For Free Now!
View this answer and more for free by performing one of the following actions

Scan the QR code to install the App and get 2 free unlocks

Unlock quizzes for free by uploading documents