The following cost graphs illustrate various types of cost behaviors. 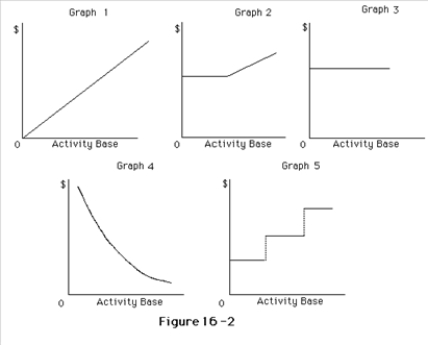
Correct Answer:
Verified
View Answer
Unlock this answer now
Get Access to more Verified Answers free of charge
Q110: The relative distribution of sales among the
Q123: The following is a list of various
Q125: Tops Company sells Products D and E
Q127: If sales amounted to $375,000,variable costs are
Q130: If a business had sales of $4,000,000,fixed
Q131: For the current year ending April 30,Philip
Q132: Currently,Unicy Company's unit selling price is $25,the
Q133: For the coming year,Belton Company estimates fixed
Q141: The difference between the current sales revenue
Q145: Cost-volume-profit analysis cannot be used if which
Unlock this Answer For Free Now!
View this answer and more for free by performing one of the following actions

Scan the QR code to install the App and get 2 free unlocks

Unlock quizzes for free by uploading documents