Which of the following graphs illustrates the nature of a mixed cost? 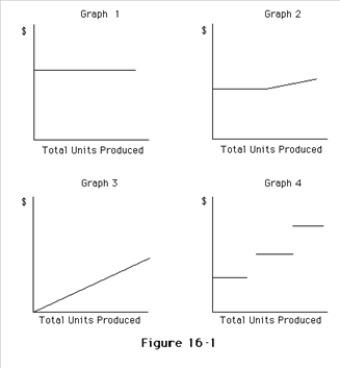
A) Graph 2
B) Graph 3
C) Graph 4
D) Graph 1
Correct Answer:
Verified
Q64: The graph of a variable cost per
Q66: Tucker Co.manufactures office furniture.During the most productive
Q67: Knowing how costs behave to change in
Q70: Costs that vary in total in direct
Q73: Winston Co.manufactures office furniture.During the most productive
Q74: Given the following costs and activity observations
Q76: Which of the following costs is a
Q77: The systematic examination of the relationships among
Q78: For the purpose of analysis, mixed costs
Q80: Which of the following is an example
Unlock this Answer For Free Now!
View this answer and more for free by performing one of the following actions

Scan the QR code to install the App and get 2 free unlocks

Unlock quizzes for free by uploading documents