Which of the following graphs illustrates the behavior of a total variable cost? 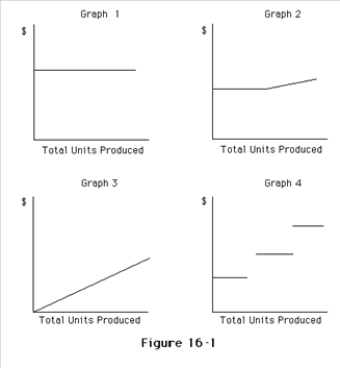
A) Graph 2
B) Graph 3
C) Graph 4
D) Graph 1
Correct Answer:
Verified
Q62: Which of the following is an example
Q62: Given the following costs and activity observations
Q63: Which of the following describes the behavior
Q63: Which of the following is true about
Q64: The graph of a variable cost per
Q66: Tucker Co.manufactures office furniture.During the most productive
Q68: As production increases,what should happen to the
Q69: Given the following cost and activity observations
Q73: Which of the following activity bases would
Q79: Which of the following statements is true
Unlock this Answer For Free Now!
View this answer and more for free by performing one of the following actions

Scan the QR code to install the App and get 2 free unlocks

Unlock quizzes for free by uploading documents