Multiple Choice
Electrostatic potential maps use color to portray the calculated electron distribution in a molecule.Atoms that are electron poor and carry a δ+ charge are shown in blue.Atoms that are electron rich and carry a δ- charge are shown in red.Atoms with little or no charge are shown in green.The electrostatic potential map of CH3Li below should show 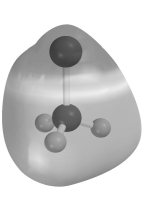
A) C blue and Li red.
B) C blue and Li green.
C) C green and Li blue.
D) C red and Li blue.
Correct Answer:
Verified
Related Questions
Q100: What are the bond angles in the
Q101: Which drawing best shows the direction of

