Here are plots of data for Studentized residuals against Length. 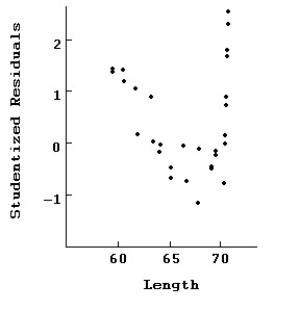
Here is the same regression with all of the points at 70 removed.
Dependent variable is: Weight
30 total bears of which 10 are missing
R-squared = 97.8% R-squared (adjusted)= 97.3%
s = 2.96 with 20 - 4 = 16 degrees of freedom 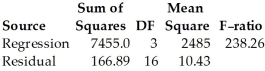
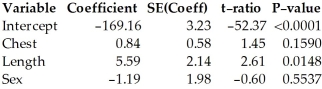
Compare the regression with the previous one.In particular,which model is likely to make the best prediction of weight? Which seems to fit the data better?
Correct Answer:
Verified
View Answer
Unlock this answer now
Get Access to more Verified Answers free of charge
Q1: What is the purpose of an indicator
Q2: An actuary wishes to predict the life
Q11: A math professor is trying to determine
Q13: The manager of a human resources department
Q14: Here are plots for Studentized residuals against
Q15: A histogram of the externally Studentized residuals
Q17: A math professor is trying to determine
Q19: How would you interpret the coefficient of
Q19: The manager of a human resources department
Q20: Here are plots of data for Studentized
Unlock this Answer For Free Now!
View this answer and more for free by performing one of the following actions

Scan the QR code to install the App and get 2 free unlocks

Unlock quizzes for free by uploading documents