An anti-smoking group used data in the table to relate the carbon monoxide output of various brands of cigarettes to their tar and nicotine content. 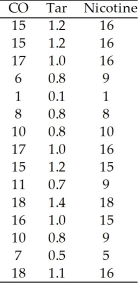
A) CO = 1.25 + 1.55 Tar - 5.79 Nicotine
B) CO = 1.38 - 5.53 Tar + 1.33 Nicotine
C) CO = 1.38 + 5.50 Tar - 1.38 Nicotine
D) CO = 1.27 - 5.53 Tar + 5.79 Nicotine
E) CO = 1.30 + 5.50 Tar - 1.33 Nicotine
Correct Answer:
Verified
Q5: Use the following computer data,which refers
Q7: This model fits 96% of the data
Q10: How much of the variation in bear
Q11: A health specialist gathered the data in
Q12: Use the following computer data,which refers
Q12: A visitor to Yellowstone National Park in
Q14: Every extra centimetre of the chest adds
Q17: Interpret the R-squared value of 84.5%.
A)84.5% of
Q19: What is the regression equation?
A)salary = 11.58
Q20: What is the regression equation?
A)calories = 5.984
Unlock this Answer For Free Now!
View this answer and more for free by performing one of the following actions

Scan the QR code to install the App and get 2 free unlocks

Unlock quizzes for free by uploading documents