Data collected from 20 students in Statistics classes included their heights (in inches)and weights (in pounds),and are displayed in the following scatterplot.Make a histogram of the weights of the children. 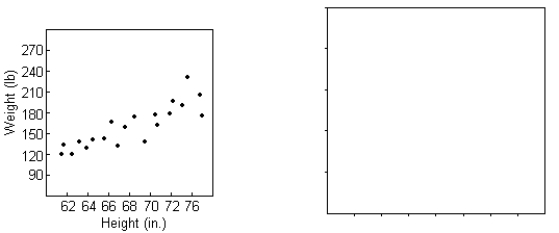
Correct Answer:
Verified
Q27: Two different tests are designed to measure
Q28: A survey was conducted in 26 counties
Q29: The table contains the daily study time
Q30: The following table gives the total sales
Q31: Determine whether the scatterplot shows little or
Q33: The paired data below consist of the
Q34: A ceramics factory can fire seven large
Q35: To get the best deal on a
Q36: A ceramics factory can fire six large
Q37: Determine whether the scatterplot shows little or
Unlock this Answer For Free Now!
View this answer and more for free by performing one of the following actions

Scan the QR code to install the App and get 2 free unlocks

Unlock quizzes for free by uploading documents