The test scores of 40 students are listed below. 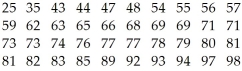
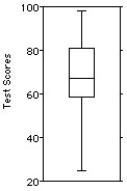
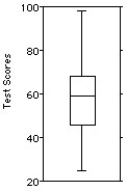
Choose the boxplot that represents the given data.
I II III 
IV V 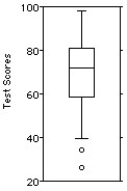
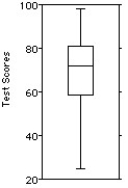
A) I
B) II
C) III
D) IV
E) V
Correct Answer:
Verified
Q36: Here are the summary statistics for mathematics
Q37: The boxplots display case prices (in dollars)of
Q38: Shown below are the boxplot and summary
Q39: The test scores of 15 students are
Q40: The boxplots display case prices (in dollars)of
Q42: Here are the average mathematics achievement scores
Q43: The reaction time of 20 drivers at
Q44: The test scores of 15 students are
Q45: The weights (in kilograms)of 27 dogs are
Q46: The frequency table shows the weight ,in
Unlock this Answer For Free Now!
View this answer and more for free by performing one of the following actions

Scan the QR code to install the App and get 2 free unlocks

Unlock quizzes for free by uploading documents