Here is the stem-and-leaf display of the midterm test scores for a high school typing class. 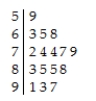
Would you use the median or the mean to describe the centre of this distribution?
A) Mean,because the data are quite symmetric.
B) Mean,because the data are skewed to the right.
C) Median,because the data are skewed to the left.
D) Mean,because the data are skewed to the left.
E) Median,because the data are skewed to the right.
Correct Answer:
Verified
Q18: Shown below are the boxplot and the
Q19: The histograms show the cost of living,in
Q20: The back-to-back stem-and-leaf display compares the percent
Q21: The weekly salaries (in dollars)of 24 randomly
Q22: The weekly salaries (in dollars)of sixteen government
Q24: Here are boxplots of the points scored
Q25: Shown below are the histogram and summary
Q26: The boxplots display case prices (in dollars)of
Q27: The weekly salaries (in dollars)of 24 randomly
Q28: Office workers were asked how long it
Unlock this Answer For Free Now!
View this answer and more for free by performing one of the following actions

Scan the QR code to install the App and get 2 free unlocks

Unlock quizzes for free by uploading documents