Shown below are the boxplot and the histogram for the weekly salaries (in dollars) of 24 randomly selected employees of a company: 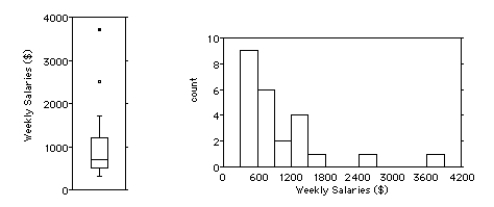
i.What features of the distribution can you see in both the histogram and the boxplot?
ii.What features of the distribution can you see in the boxplot that you could not see in the histogram?
A) i) The distribution is unimodal and skewed to the right,with two outliers at $2500 and about $3700.The mean is greater than the median because of the skewedness.
ii.You can more easily tell from the boxplot that the median is about $700 with quartiles at about $500 and $1200.
B) i) The distribution is symmetrical,with two outliers at $2900 and about $3000.The mean and median are about the same.
ii.You can more easily tell from the boxplot that the mean is about $500 with quartiles at about $700 and $1800.
C) i) The distribution is unimodal and skewed to the left,with two outliers at $2500 and about $3700.The mean is lower than the median because of the skewedness.
ii.You can more easily tell from the boxplot that the median is about $900 with quartiles at about $1100 and $1600.
D) i) The distribution is unimodal and skewed to the right,with two outliers at $2900 and about $3000.The mean is greater than the median because of the skewedness.
ii.You can more easily tell from the boxplot that the median is about $700 with quartiles at about $500 and $1200.
E) i) The distribution is symmetrical,with two outliers at $2500 and about $3700.The mean and median are about the same.
ii.You can more easily tell from the boxplot that the mean is about $700 with quartiles at about $500 and $1200.
Correct Answer:
Verified
Q5: For which class are the mean and
Q10: Match each class with the corresponding boxplot
Q11: Shown below are the boxplot and the
Q15: Describe what these boxplots tell you about
Q16: Which class had the smallest standard deviation?
A)Class
Q16: Do men and women run a 5-kilometre
Q18: Shown below are the boxplot and the
Q19: Which class had the smallest IQR?
A)Class 1,because
Q19: The histograms show the cost of living,in
Q20: Which class had the highest mean score?
A)Class
Unlock this Answer For Free Now!
View this answer and more for free by performing one of the following actions

Scan the QR code to install the App and get 2 free unlocks

Unlock quizzes for free by uploading documents