Three statistics classes (50 students each) took the same test.Shown below are histograms of the scores for the classes.Use the histograms to answer the question. 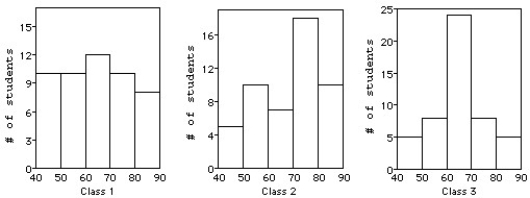
-Which class had the smallest IQR?
A) Class 3,because the shape is symmetric and unimodal.
B) Class 3,because the shape has the highest number of students.
C) Class 2,because the shape is skewed.
D) Class 1,because the shape is fairly symmetric and uniform.
E) None,because all the classes had the same IQR.
Correct Answer:
Verified
Q7: Which class had the largest standard deviation?
A)Class
Q77: In May 2011,17 coffee shops in Toronto
Q78: A business owner recorded her annual profits
Q79: Members of the Ontario Field Ornithologists (OFO)observe
Q80: In a survey,20 people were asked how
Q81: How would you describe the shape of
Q84: A sewing supply company has a database
Q85: Students were asked to make a histogram
Q86: For class 2,compare the mean and the
Q87: A weight-loss company used the following histogram
Unlock this Answer For Free Now!
View this answer and more for free by performing one of the following actions

Scan the QR code to install the App and get 2 free unlocks

Unlock quizzes for free by uploading documents