The stem-and-leaf diagram shows the ages of 17 people at a playground in London,Ontario. 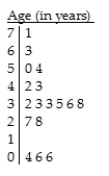
Key:
3 | 3 = 33 years
A) The distribution of the ages of people at the playground is skewed to the left,with a typical age between 32 and 38.With the exception of the 3 people less than 10 years old,the ages are between 27 and the maximum 71 .
B) The distribution of the ages of people at the playground is skewed to the right,with a typical age between 42 and 54.With the exception of the 3 people less than 10 years old,the ages are between 27 and the maximum 71.
C) The distribution of the ages of people at the playground is skewed to the right,with a typical age between 27 and 71 .There are 3 outliers,when people are less than 10 years old.
D) The distribution of the ages of people at the playground is skewed to the right,with a typical age between 32 and 38 .
E) The distribution of the ages of people at the playground is skewed to the right,with a typical age between 32 and 38.With the exception of the 3 people less than 10 years old,the ages are between 27 and the maximum 71.
Correct Answer:
Verified
Q66: The diastolic blood pressures,in mm Hg,for a
Q67: The data below represent the midterm grades
Q68: In a survey,26 voters were asked their
Q69: A dotplot of the number of tornadoes
Q70: A student at a local university took
Q72: The diastolic blood pressures,in mm Hg,for a
Q73: The weights,in kilograms,of the members of the
Q74: Three statistics classes (50 students each)took the
Q75: Which set has the largest standard deviation?
Q76: The data below give the number of
Unlock this Answer For Free Now!
View this answer and more for free by performing one of the following actions

Scan the QR code to install the App and get 2 free unlocks

Unlock quizzes for free by uploading documents