A university instructor created a website for her Chemistry course.The students in her class were encouraged to use the website as an additional resource for the course.At the end of the semester,the instructor asked each student how many times he or she visited the website and recorded the counts.Based on the histogram below,describe the distribution of website use. 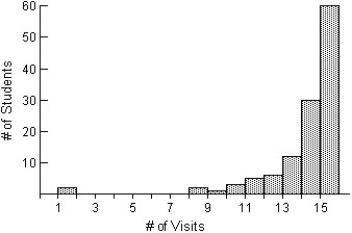
A) The distribution of the number of visits to the course website by each student for the semester is skewed to the left,with the number of visits ranging from 1 to 15 visits.The distribution is centred at about 14 visits,with many students visiting 15 times.
B) The distribution of the number of visits to the course website by each student for the semester is skewed to the left,with the number of visits ranging from 1 to 16 visits.The distribution is centred at about 14 visits,with many students visiting 15 times.There is an outlier in the distribution,two students who visited the site only once.The next highest number of visits was 8.
C) The distribution of the number of visits to the course website by each student for the semester is skewed to the right,with the number of visits ranging from 1 to 15 visits.The distribution is centred at about 14 visits,with many students visiting 15 times.There is an outlier in the distribution,two students who visited the site only once.The next highest number of visits was 8.
D) The distribution of the number of visits to the course website by each student for the semester is skewed to the left,with the number of visits ranging from 1 to 15 visits.The distribution is centred at about 14 visits,with many students visiting 15 times.There is an outlier in the distribution,two students who visited the site only once.The next highest number of visits was 8.
E) The distribution of the number of visits to the course website by each student for the semester is skewed to the left,with the number of visits ranging from 1 to 15 visits.The distribution is centred at about 12 visits,with many students visiting 15 times.There is an outlier in the distribution,two students who visited the site only once.The next highest number of visits was 8.
Correct Answer:
Verified
Q2: Here is the stem-and-leaf display of the
Q2: Heights of adult women attending a concert.
A)The
Q4: The histogram displays the body fat percentages
Q5: Shown below are the histogram and summary
Q8: Ages of high school students.
A)The distribution would
Q11: Office workers were asked how long it
Q12: Number of times each face of a
Q13: Ages of patients who had their tonsils
Q14: Heights of a group of male professional
Q33: A small company employs a supervisor at
Unlock this Answer For Free Now!
View this answer and more for free by performing one of the following actions

Scan the QR code to install the App and get 2 free unlocks

Unlock quizzes for free by uploading documents