Table 4.2 - Demand schedule for automobiles
The following is a hypothetical demand schedule for automobiles. 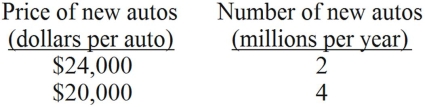
-In Table 4.2,as price decreases from $24,000 per car to $20,000 per car:
A) The demand curve for cars shifts to the right.
B) Total revenue increases.
C) The quantity of cars demanded decreases.
D) The supply curve for cars shifts to the left.
Correct Answer:
Verified
Q102: Table 4.2 - Demand schedule for automobiles
The
Q103: Demand is the desire to purchase a
Q104: Market demand is the sum of individual
Q105: Tastes and income are some of the
Q106: The demand for such items as vacation
Q108: Table 4.2 - Demand schedule for automobiles
The
Q109: At a point of diminishing marginal utility,marginal
Q110: One NEWS WIRE article states that an
Q111: One HEADLINE article reports that the United
Q112: The demand for such items as salt,sugar
Unlock this Answer For Free Now!
View this answer and more for free by performing one of the following actions

Scan the QR code to install the App and get 2 free unlocks

Unlock quizzes for free by uploading documents