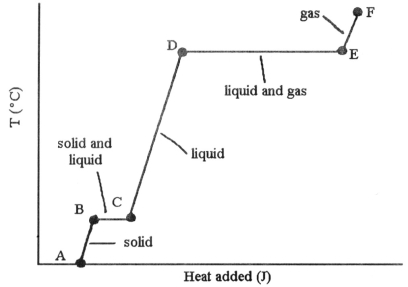
-The heating curve shown was generated by measuring the heat flow and temperature for a solid as it was heated. The slope of the ________ segment corresponds to the heat capacity of the gas.
A) AB
B) BC
C) CD
D) DE
E) EF
Correct Answer:
Verified
Q68: On the phase diagram shown above,segment _
Q70: Q70: For a given substance that exhibits liquid-crystalline Q71: In the _ liquid crystalline phase, the Q72: Based on molecular mass and dipole moment Q73: Q76: Cholesteric liquid crystals are colored because _. Q77: For a given substance that exhibits liquid-crystalline Q79: In the _ liquid crystalline phase, the Q80: Unlock this Answer For Free Now! View this answer and more for free by performing one of the following actions Scan the QR code to install the App and get 2 free unlocks Unlock quizzes for free by uploading documents![]()
![]()
A)each![]()

