Multiple Choice
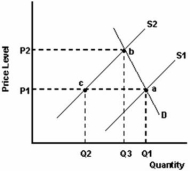
-Refer to the graph above to answer this question.What does the distance Q1 - Q3 represent?
A) The decrease in equilibrium quantity traded resulting from a decrease in demand.
B) The decrease in equilibrium quantity traded resulting from a decrease in supply.
C) The decrease in equilibrium quantity traded resulting from a decrease in the quantity supplied.
D) The decrease in equilibrium quantity traded resulting from an increase in the quantity supplied.
Correct Answer:
Verified
Related Questions

