The product is a normal product.
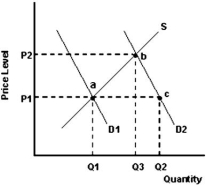
-Refer to the graph above to answer this question.What does the distance Q1 to Q3 represent?
A) The increase in equilibrium quantity traded resulting from an increase in demand.
B) The decrease in equilibrium quantity traded resulting from an increase in demand.
C) The increase in equilibrium quantity traded resulting from an increase in quantity demanded.
D) The increase in equilibrium quantity traded resulting from an increase in quantity supplied.
E) A shortage at price P2.
Correct Answer:
Verified
Q62: What is the effect on product A
Q63: The product is a normal product.
Q64: The following table shows the initial weekly
Q65: The product is a normal product.
Q66: What is the effect on a normal
Q68: What is the effect on an inferior
Q69: What is the effect of consumers' expecting
Q70: The product is a normal product.
Q71: The product is a normal product.
Q72: ![]()
Unlock this Answer For Free Now!
View this answer and more for free by performing one of the following actions

Scan the QR code to install the App and get 2 free unlocks

Unlock quizzes for free by uploading documents