Multiple Choice
The product is a normal product.
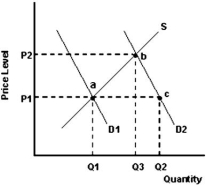
-Refer to the graph above to answer this question.What does the distance Q1 to Q2 represent?
A) An increase in the quantity demanded.
B) A surplus at price P1.
C) A shortage at price P1.
D) The result of a decrease in income.
Correct Answer:
Verified
Related Questions

