In the graph below six short-run average cost curves labeled a through f are illustrated.
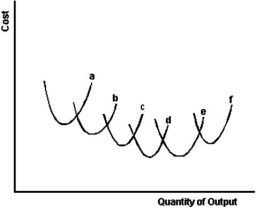
-Refer to the graph above to answer this question.Which set of short-run average cost curves illustrates economies of scale?
A) a and b only
B) a,b and c only
C) a,b,c,and d
D) d and e only
E) e and f only.
Correct Answer:
Verified
Q51: Suppose that a firm's output increases from
Q52: All of the following,except one,would result in
Q53: Q54: In the graph below six short-run average Q55: Under what circumstances does an increase in Q57: Assume that a firm's total cost of Q58: Assume that a firm's total cost of Q59: In the graph below six short-run average![]()
Unlock this Answer For Free Now!
View this answer and more for free by performing one of the following actions

Scan the QR code to install the App and get 2 free unlocks

Unlock quizzes for free by uploading documents