The following graph depicts the various cost curves for a representative competitive firm producing quantity Q1:
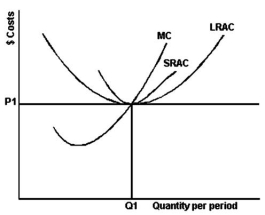
-Refer to the above graph to answer this question.If the price of the product is P1,what does the graph suggest?
A) The firm is making economic profits in the short run but not in the long run.
B) The firm is making economic profits in the long run but not in the short run.
C) The firm is making economic profits in both the short run and the long run.
D) The firm is not making economic profits in either the short run or the long run.
Correct Answer:
Verified
Q15: What is allocative efficiency?
A)Production of a combination
Q16: Under what conditions will a competitive firm
Q17: The following are cost data for four
Q18: What is productive efficiency?
A)Production of a combination
Q19: What does a belief in the doctrine
Q21: What are external benefits?
A)The benefits that are
Q22: Which of the following products are non-excludable?
A)Education
Unlock this Answer For Free Now!
View this answer and more for free by performing one of the following actions

Scan the QR code to install the App and get 2 free unlocks

Unlock quizzes for free by uploading documents