The following graph depicts the various cost curves for a representative competitive firm producing quantity Q1:
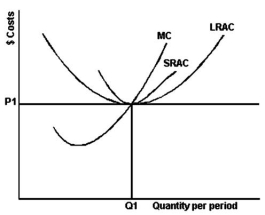
-Refer to the above graph to answer this question.If the price of the product is P1,what does the graph suggest?
A) The market is achieving productive efficiency but not necessarily allocative efficiency.
B) The market is achieving allocative efficiency but not necessarily productive efficiency.
C) The market is achieving neither productive efficiency nor allocative efficiency.
D) The market is achieving both allocative efficiency and productive efficiency.
Correct Answer:
Verified
Q8: What is the term for production of
Q9: What will happen if all competitive firms
Q10: In what way is the market system
Q11: What is the term for the production
Q12: What is implied if an economy achieves
Q14: All of the following except one are
Q15: What is allocative efficiency?
A)Production of a combination
Q16: Under what conditions will a competitive firm
Q17: The following are cost data for four
Q18: What is productive efficiency?
A)Production of a combination
Unlock this Answer For Free Now!
View this answer and more for free by performing one of the following actions

Scan the QR code to install the App and get 2 free unlocks

Unlock quizzes for free by uploading documents