The following graph shows the market demand and average cost curve for electricity (in millions of kilowatts) in an urban centre:
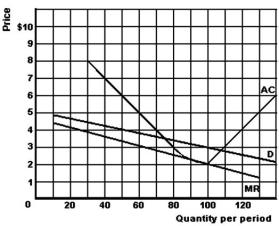
-Refer to the above graph to answer this question.Suppose that the price is $3,and the market is served by two competing firms,each having 50% of the market.What will be the profit or loss made by each firm?
A) $0.
B) Loss of $50.
C) Loss of $100.
D) Loss of $150.
E) Profit of $100.
Correct Answer:
Verified
Q67: The following graph gives cost and revenue
Q68: The following graph gives cost and revenue
Q69: The following graph gives cost and revenue
Q70: What is meant by the term socially
Q71: The following graph gives cost and revenue
Q73: All of the following except one are
Q74: What effect does a lump-sum profit tax
Q75: What is a natural monopoly?
A)A market where
Q76: The following graph shows the market demand
Q77: The following graph gives cost and revenue
Unlock this Answer For Free Now!
View this answer and more for free by performing one of the following actions

Scan the QR code to install the App and get 2 free unlocks

Unlock quizzes for free by uploading documents