Multiple Choice
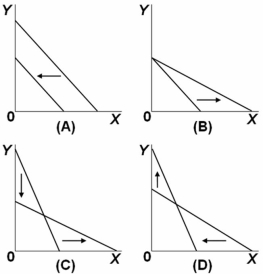 Refer to the above graphs.Which of the above pairs of budget constraint lines illustrates a decrease in the price of good X and an increase in the price of good Y?
A) Graph A
B) Graph B
C) Graph C
D) Graph D
Correct Answer:
Verified
Related Questions

