The data in the table show the marginal costs and marginal benefits to a city for five different levels of pollution control. 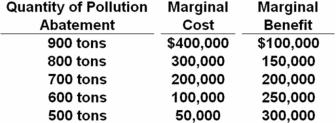 Refer to the above table.What would cause the optimal level of pollution abatement to be 600 tons?
A) An increase in marginal costs by $150,000 at each level
B) An increase in marginal benefits by $200,000 at each level
C) A decrease in marginal costs by $150,000 at each level
D) A decrease in marginal benefits by $100,000 at each level
Correct Answer:
Verified
Q49: A producer's minimum acceptable price for a
Q89: The data in the table show the
Q90: Q92: Graphically,producer surplus is measured as the area: Q95: The air pollution policy of the United Q96: Jennifer buys a piece of costume jewelry Q97: The data in the table show the Q98: Suppose the government imposed a carbon tax Q159: A market for pollution rights can be Q192: By requiring car producers to install emission![]()
A)
Unlock this Answer For Free Now!
View this answer and more for free by performing one of the following actions

Scan the QR code to install the App and get 2 free unlocks

Unlock quizzes for free by uploading documents