Multiple Choice
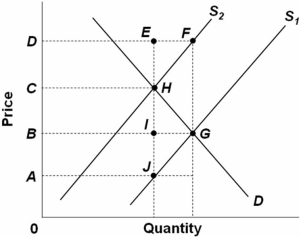 The graph above shows the market for a product where S1 is the original supply curve and S2 is the new supply curve following a tax on producers to reduce pollution.The tax per unit of output is:
A) AB.
B) AC.
C) BG.
D) AJ.
Correct Answer:
Verified
Related Questions
Q59: In a market where there are external
Q60: If there are positive externalities associated with
Q61: Which antipollution policy would be least likely

