Multiple Choice
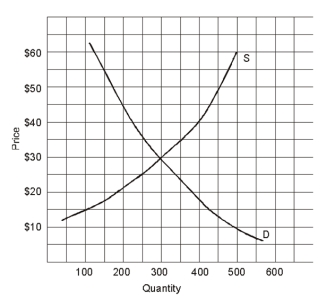
-In the graph shown above at a price of $25
A) there is a surplus.
B) there is a shortage.
C) quantity demanded is greater than quantity supplied.
D) there is a shortage and quantity demanded is greater than quantity supplied,but there is not a surplus.
E) there is a surplus and quantity demanded is greater than quantity supplied,but there is not a shortage.
Correct Answer:
Verified
Related Questions

