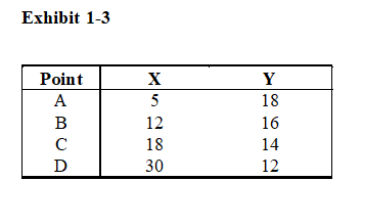
-Refer to Exhibit 1-2.Based on the data provided in this table,if these data were plotted in a two-variable diagram the result would be ______________ sloping ____________________.
A) a downward; (nonlinear) curve
B) a downward; (straight) line
C) an upward; (nonlinear) curve
D) an upward; (straight) line
E) none of the above
Correct Answer:
Verified
Q133: In a two-variable diagram,there is a straight
Q134: Q135: The coordinates of point A are 30 Q136: Q137: A characteristic of a 45-degree line is Q139: Many people buy one newspaper per day,but Q140: According to economists,competition exists because of Q141: If an economist says "the higher the Q142: Economists use the ceteris paribus assumption primarily Q143: Which of the following is not one![]()
![]()
A) scarcity.
B)
Unlock this Answer For Free Now!
View this answer and more for free by performing one of the following actions

Scan the QR code to install the App and get 2 free unlocks

Unlock quizzes for free by uploading documents