Figure 27-1.The figure shows a utility function. 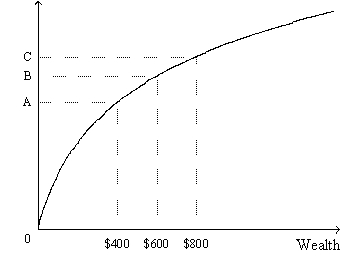
-Refer to Figure 27-1.Let 0A represent the distance between the origin and point A; let AB represent the distance between point A and point B; etc.Which of the following ratios best represents the marginal utility per dollar when wealth increases from $400 to $600?
A)
B)
C)
D)
Correct Answer:
Verified
Q1: Figure 27-1.The figure shows a utility function.
Q5: A high-ranking corporate official of a well-known
Q7: If the efficient markets hypothesis is correct,then
A)the
Q7: Risk aversion helps to explain various things
Q25: The problem of moral hazard arises because
A)life
Q30: Figure 27-5.On the graph,x represents risk and
Q33: A measure of the volatility of a
Q36: Figure 27-3.The figure shows a utility function
Q70: Which of the following best illustrates moral
Q195: A company that produces computer peripherals is
Unlock this Answer For Free Now!
View this answer and more for free by performing one of the following actions

Scan the QR code to install the App and get 2 free unlocks

Unlock quizzes for free by uploading documents