The following titration curve depicts the titration of a weak base with a strong acid.Which of the labeled points is the equivalence point. 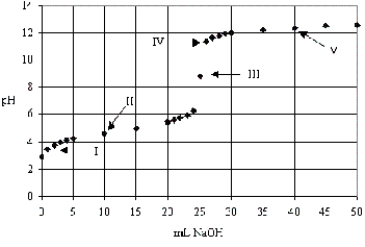
A) III only
B) II only
C) I only
D) V only
E) IV only
Correct Answer:
Verified
Q125: A 25.00-mL sample of propionic acid,HC3H5O2,of unknown
Q126: If 20 mL of 0.10 M NaOH
Q127: What is the hydronium-ion concentration of a
Q128: A 75.0-mL sample of 0.0500 M HCN
Q129: A 25.00-mL sample of propionic acid,HC3H5O2,of unknown
Q131: A solution contains 10.mmol of H3PO4 and
Q132: A weak base is titrated with a
Q133: Which acid-base combination is depicted by this
Q134: Titration of 0.2834 g of an unknown
Q135: Which of the following statements is true
Unlock this Answer For Free Now!
View this answer and more for free by performing one of the following actions

Scan the QR code to install the App and get 2 free unlocks

Unlock quizzes for free by uploading documents